exp-sd.com
exp-sd.com is for experimental tests I make to do with new technologies or ideas we're planning for future work. These test will not be the finished article but they demonstrate what can happen with various software or coding.
Stock Price Graph
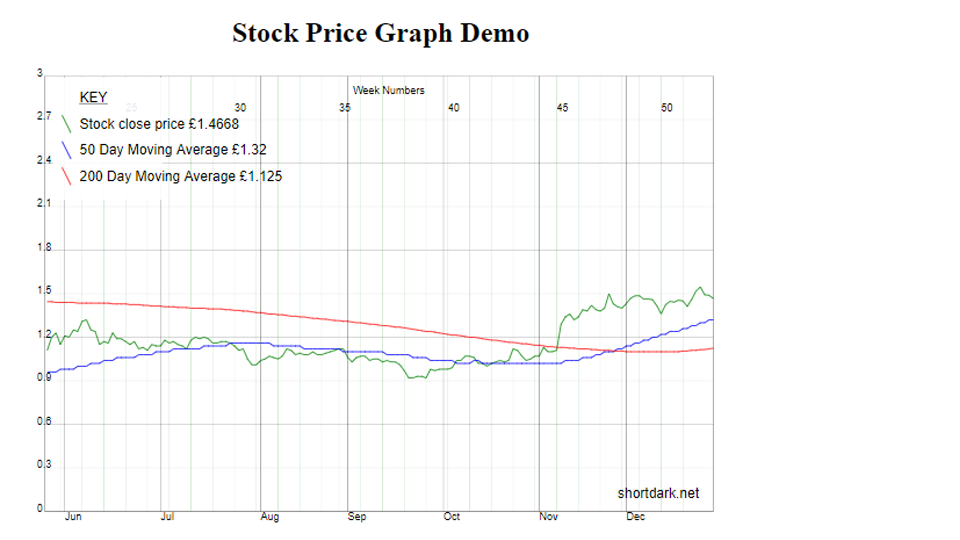
The graph package from 2016 is modified slightly in terms of how it goes through the data. For the case where there is no data collected at weekends, I re-wrote the script so that it is still able to divide the weeks up, and it knows where the new month/year is even if it falls on a weekend.
The code has become a composer package.
The graph in the image shows the changes in a stock's price with its 50 and 200-day moving average.
Added: 02 Jan 2021
Modified: 26 Dec 2021